Overview and Nodes
Both screens are for admins only and read only. They show the cluster selected in the header.
Overview
You want to: see in ten seconds whether the cluster is healthy. Admins land here after sign-in; g o from
anywhere.
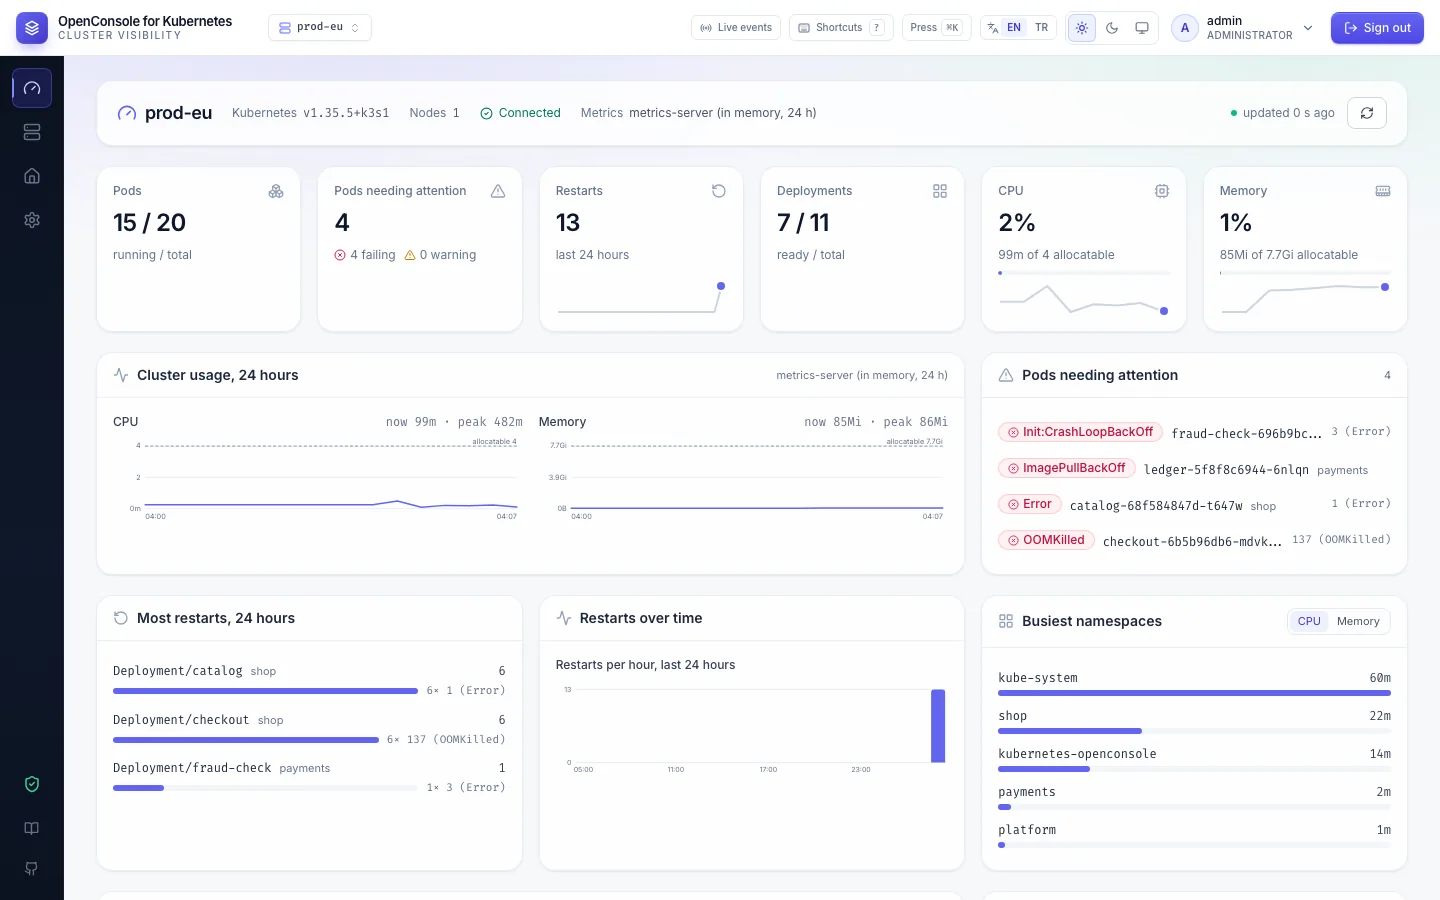
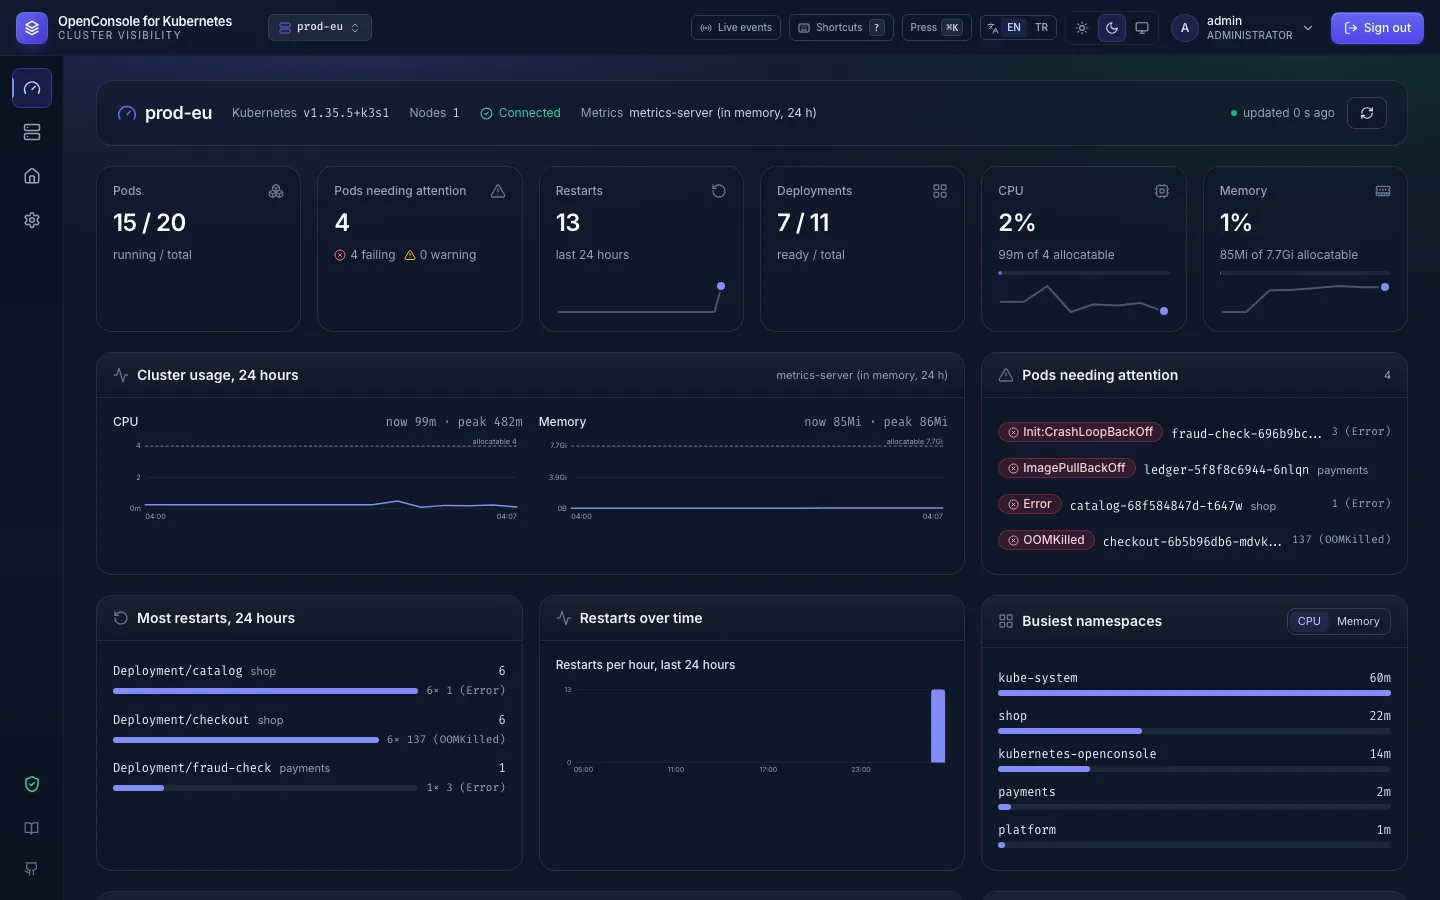
- Tiles: pods running, pods needing attention (failing / warning), restarts in 24 hours, Deployments ready, CPU and memory as % of allocatable, each with a 24-hour trend.
- Cluster usage, 24 hours against allocatable.
- Pods needing attention with their status and last exit; Most restarts with the usual exit code; Restarts over time; Busiest namespaces (pods closest to their limits).
- Warnings from the last 15 minutes and a node strip; a node opens on the Nodes screen.
- Live events opens for the whole cluster, on Warnings.
Nodes
You want to: know which node is full, cordoned or under pressure, and what runs on it. g n, or the rail.
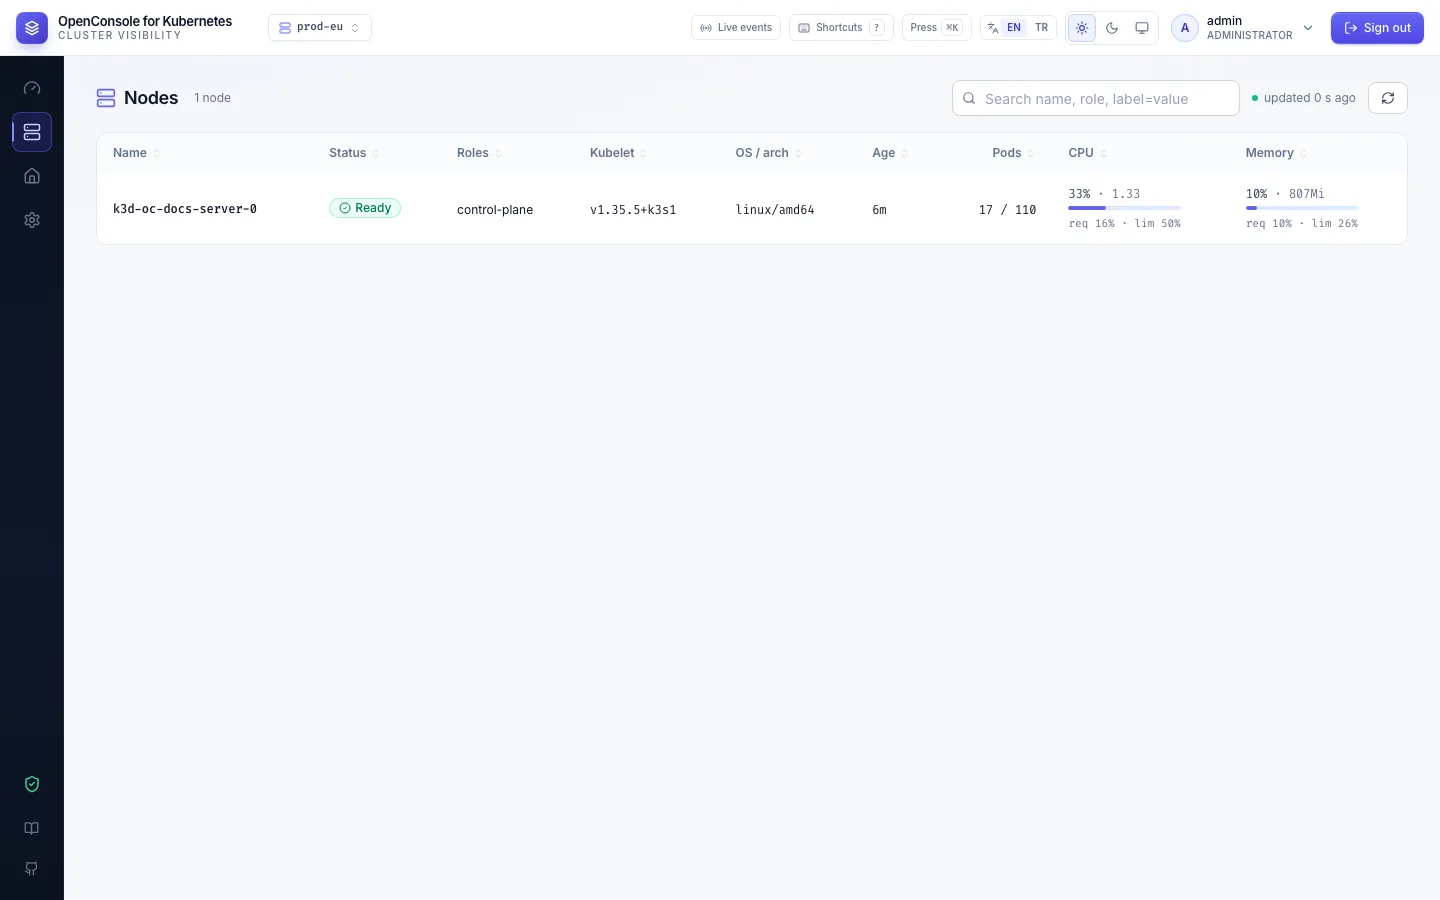
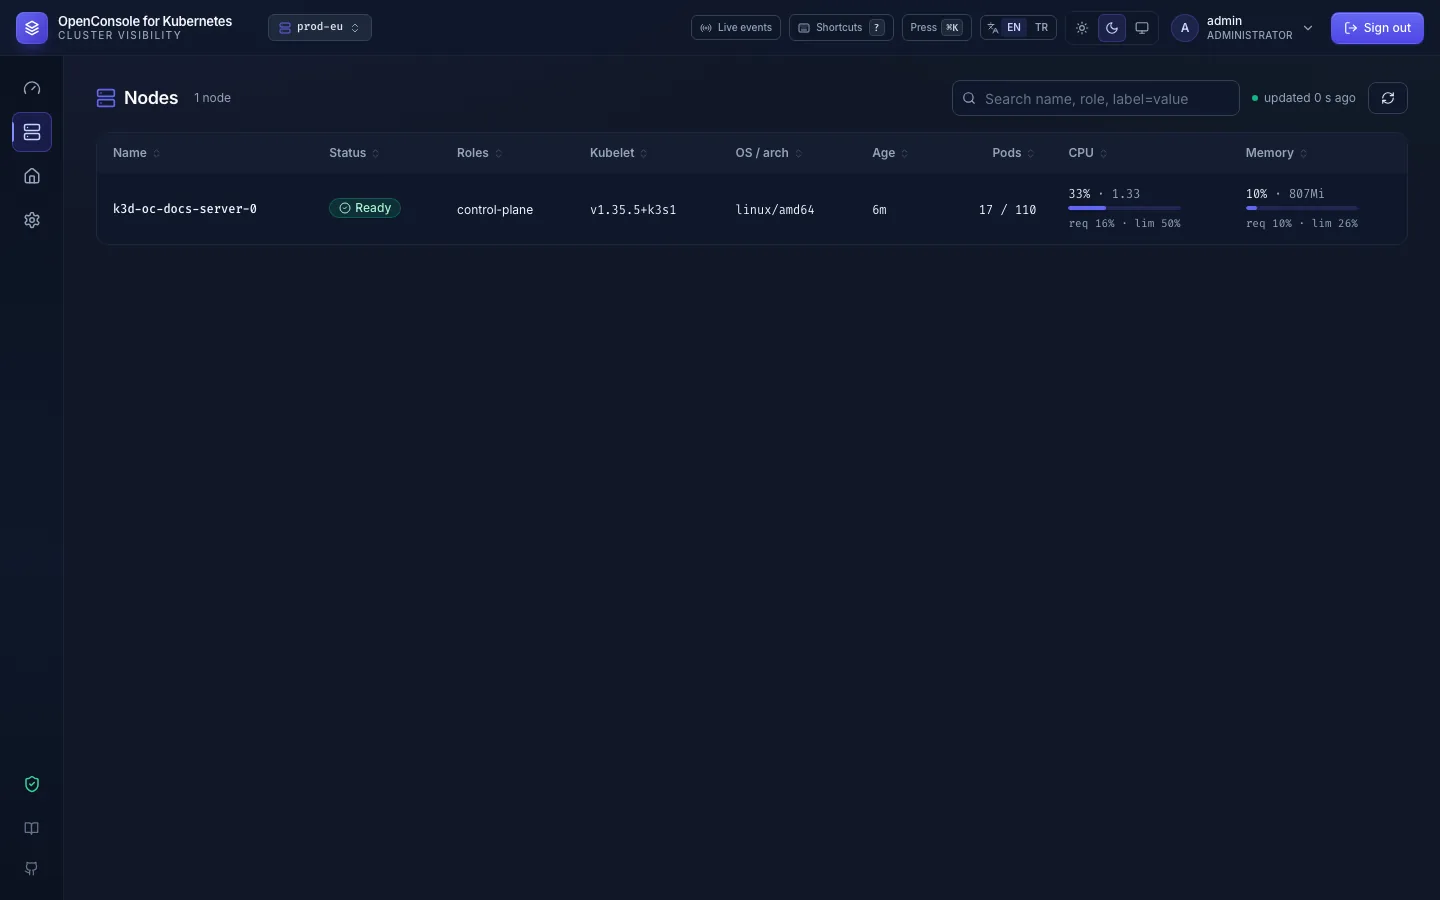
Status (Ready / NotReady / pressure, cordoned), roles, kubelet version, OS / architecture, age, pods against
capacity, and CPU / memory used, requested and limited as % of allocatable. Search by name, role or label
(key=value). Click a node for its drawer:
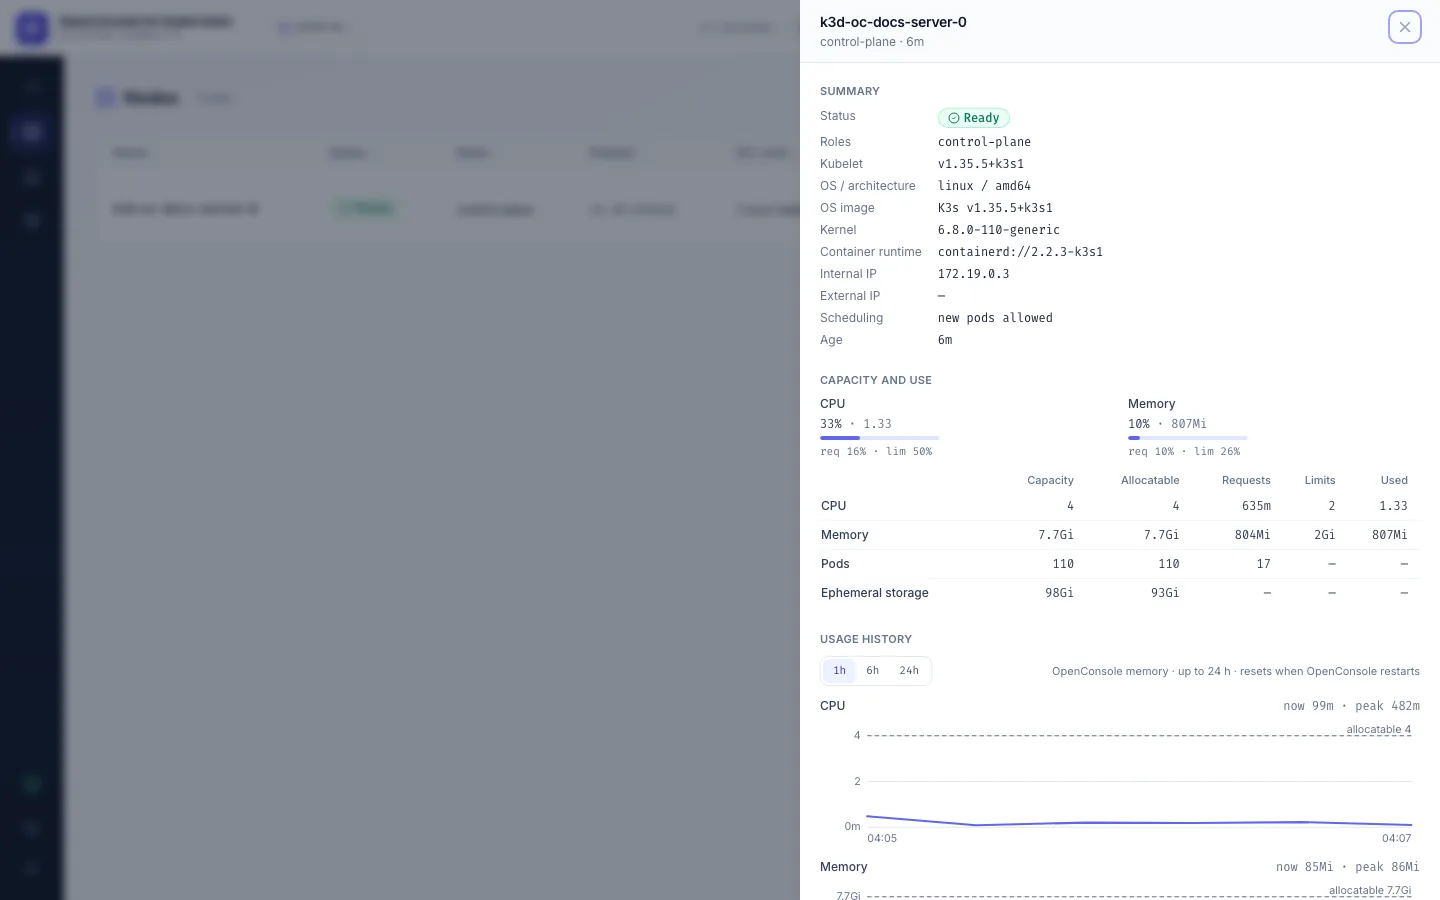
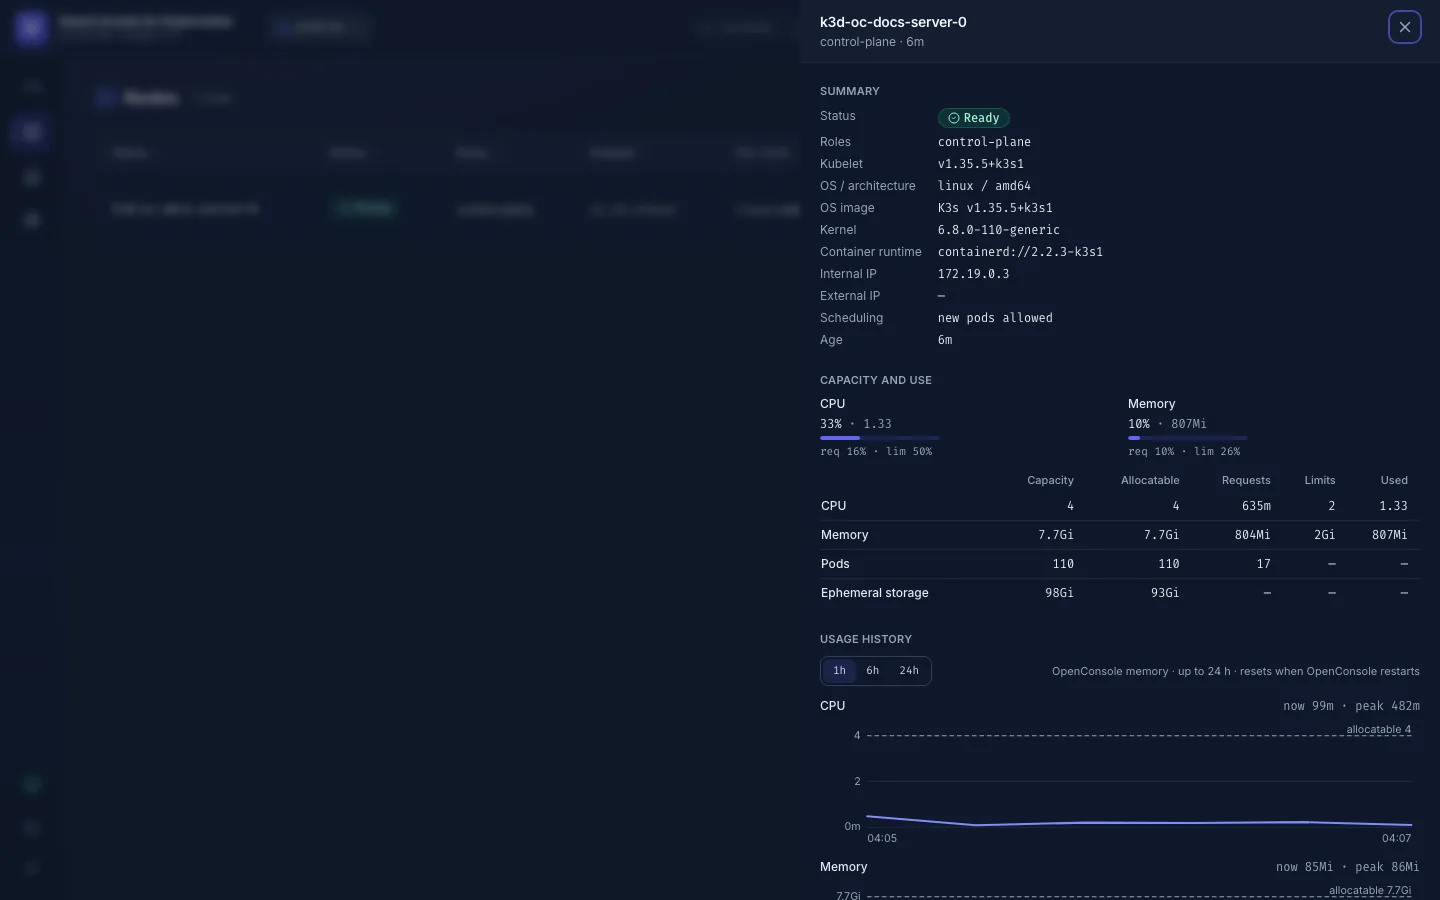
Summary (OS image, kernel, runtime, IPs, cordoned), capacity / allocatable / requests / limits / used for CPU, memory, pods and ephemeral storage, usage history (1 h / 6 h / 24 h, 7 days with Prometheus), its busiest pods, every pod on it, conditions, taints, labels, annotations and events.
Where the numbers come from
| Data | Source | Needs in the ClusterRole |
|---|---|---|
| pods, workloads, events | the informer cache | the read rules of rbac.yaml |
| node list, capacity, conditions | the informer cache | nodes: get / list / watch |
| current CPU / memory | metrics-server, sampled every 30 s | metrics.k8s.io pods and nodes: get / list |
| usage history | OpenConsole's memory (24 h, reset on restart), or Prometheus (up to 7 days) | for Prometheus "in the cluster": services/proxy on its Service |
Without the nodes rules the Overview still works with absolute CPU / memory and no node strip, and Nodes says the
connection can't list nodes. Opening the Overview is audited (cluster.view_overview), the node screens as
node.list / node.get; their own refreshes are not.