Dashboard
You want to: find your workload and see at a glance whether it is healthy.
The Dashboard shows one namespace of your current cluster (Choosing a cluster and namespace).
It refreshes on its own every 10 seconds; Refresh (or r) does it now.
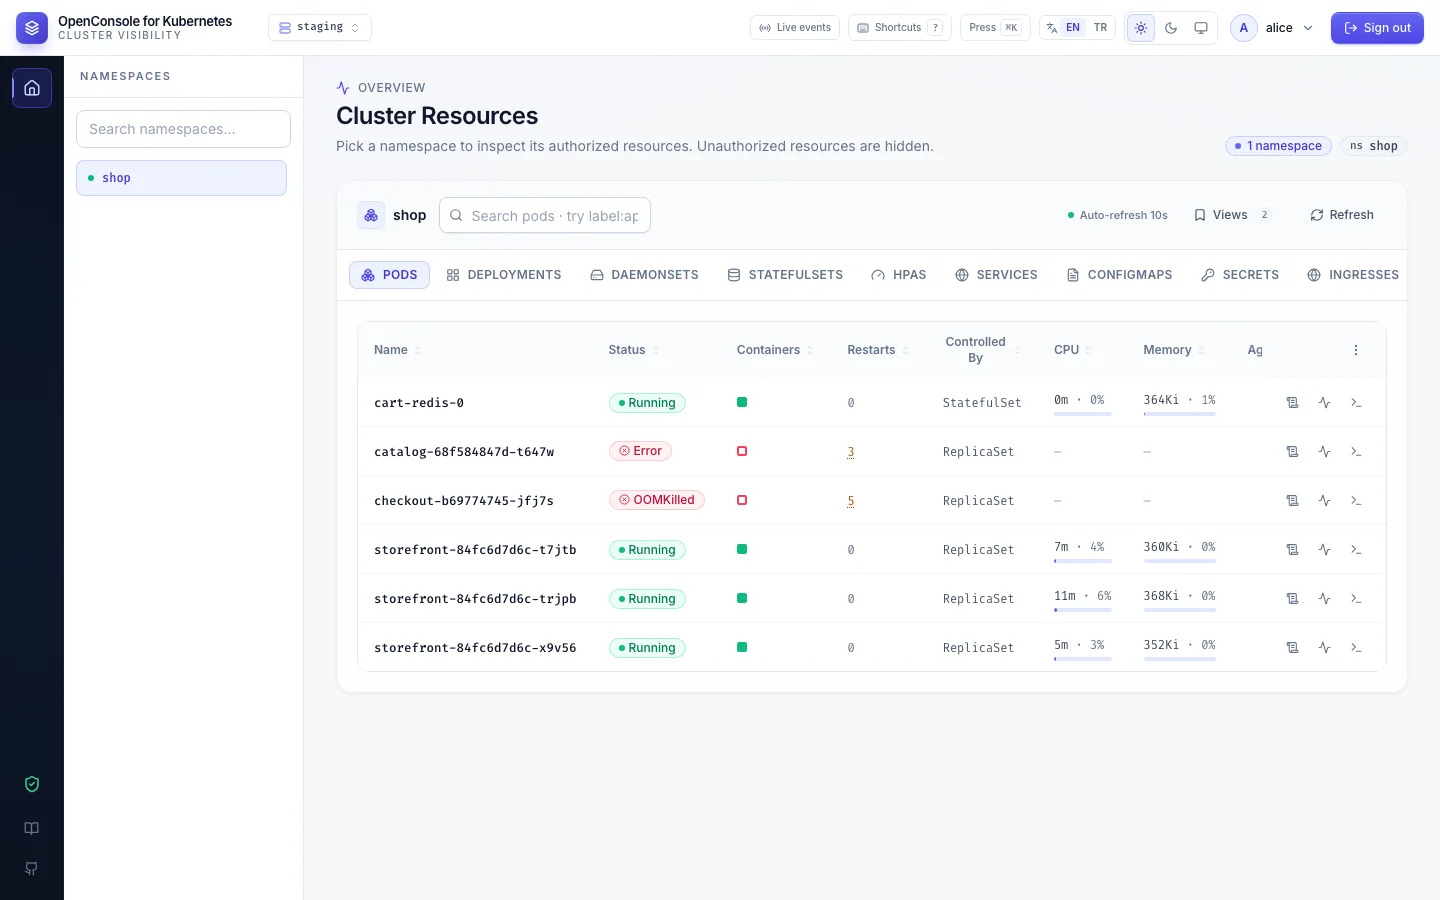
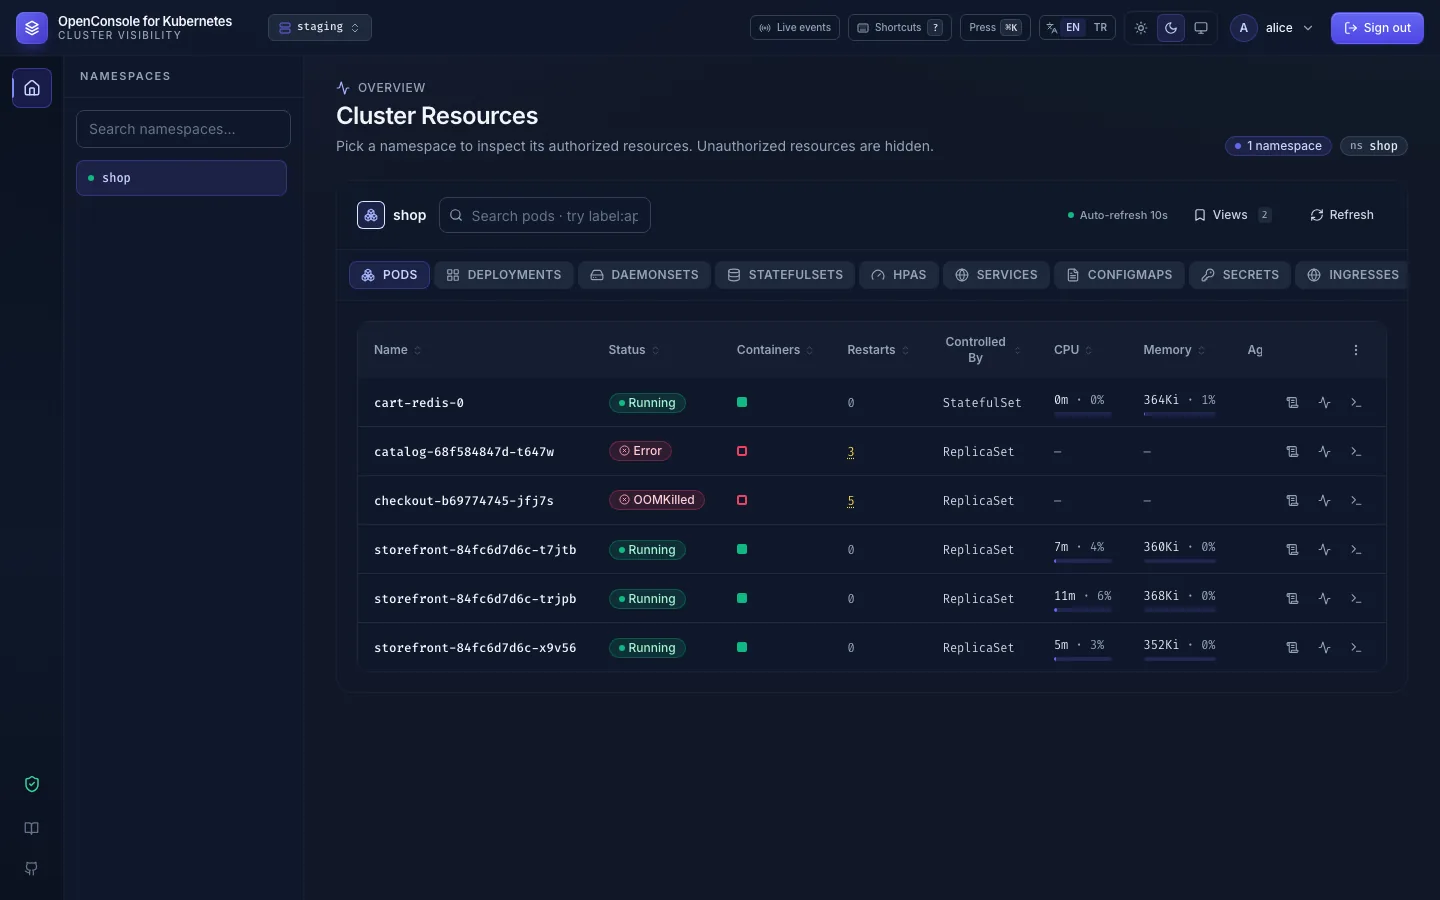
Tabs
Pods, Deployments, DaemonSets, StatefulSets, HPAs, Services, ConfigMaps, Secrets, Ingresses, CronJobs and Jobs;
you see the ones you may list. [ and ] move to the previous and next tab (on a Turkish keyboard ğ and ü).
The Deployments, StatefulSets and DaemonSets tabs mark a workload with a red N pods failing badge when one of its pods is crashing:
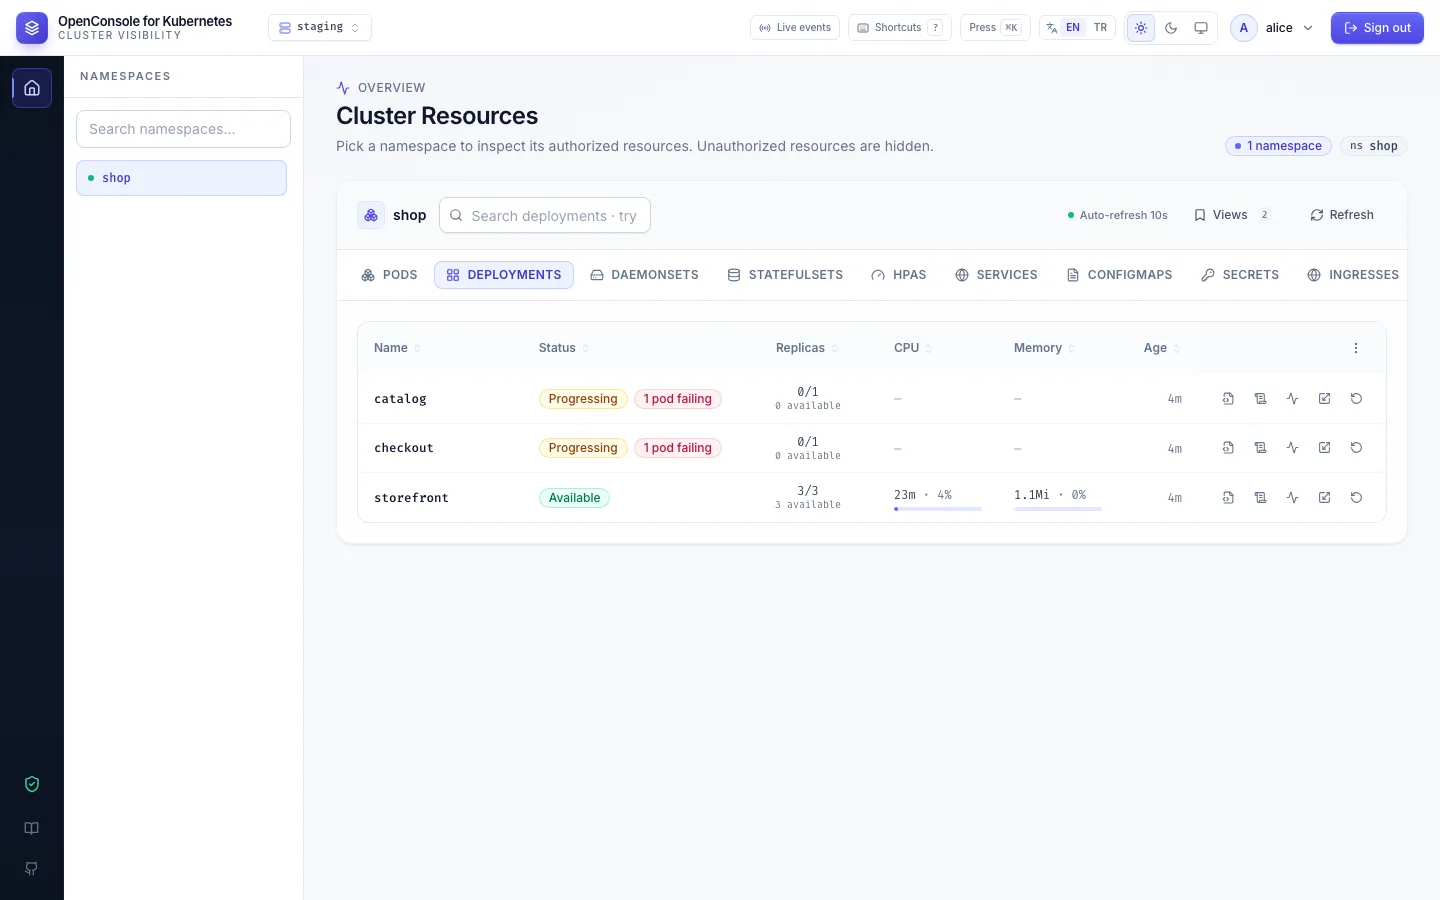
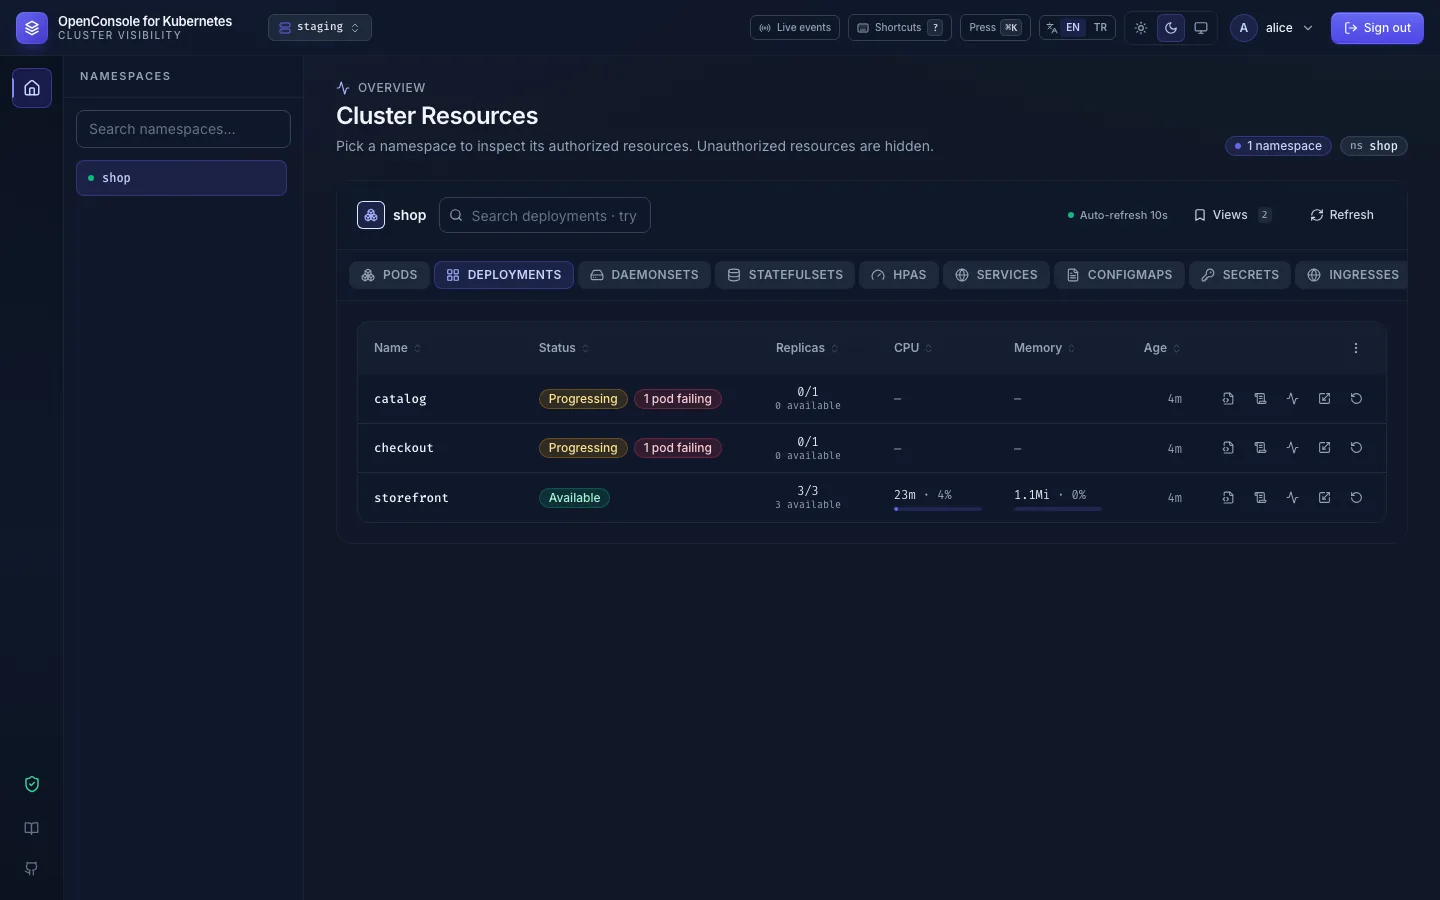
List or cards
The two buttons next to the search switch between a table and cards. The table sorts by any column (click its header). Cards show the same facts with the action buttons on each card:
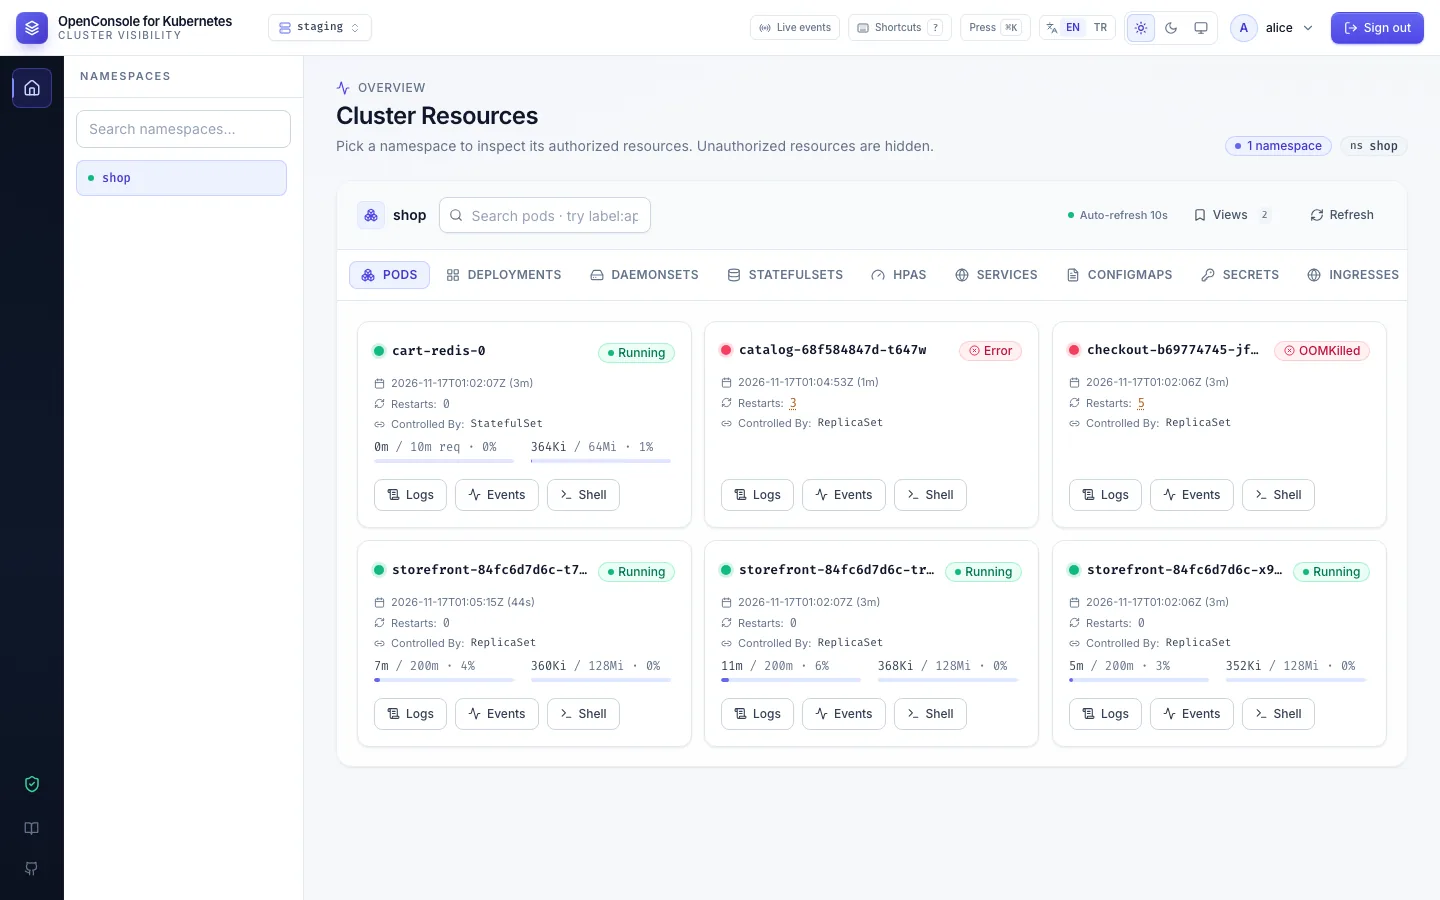
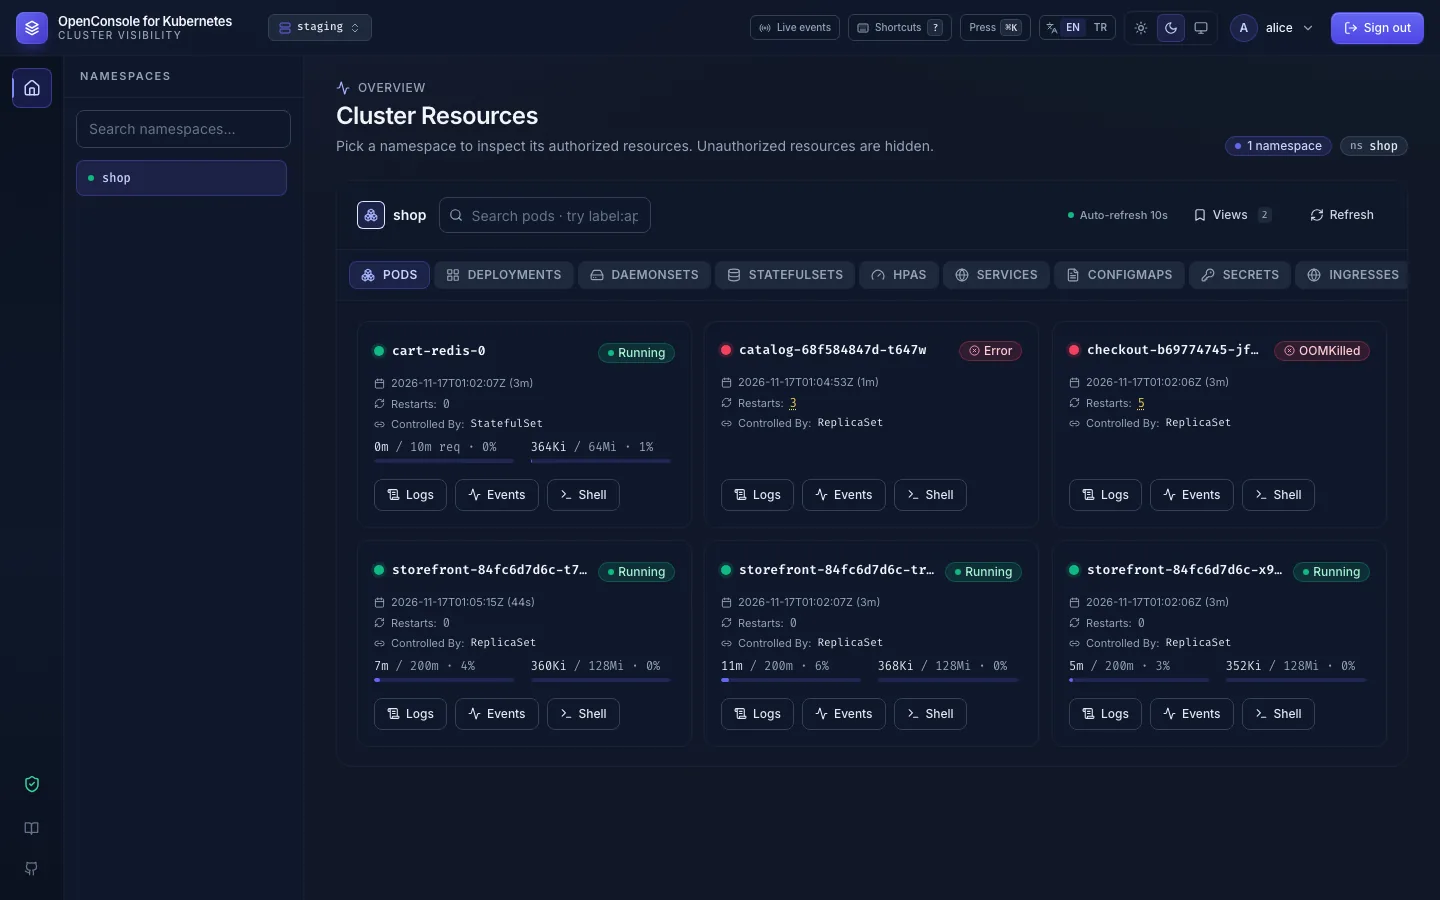
Columns
In the table, the ⋮ at the right end of the header row chooses which columns show, per tab. Name always stays; Reset to default shows all of them again. The choice is kept in this browser only.
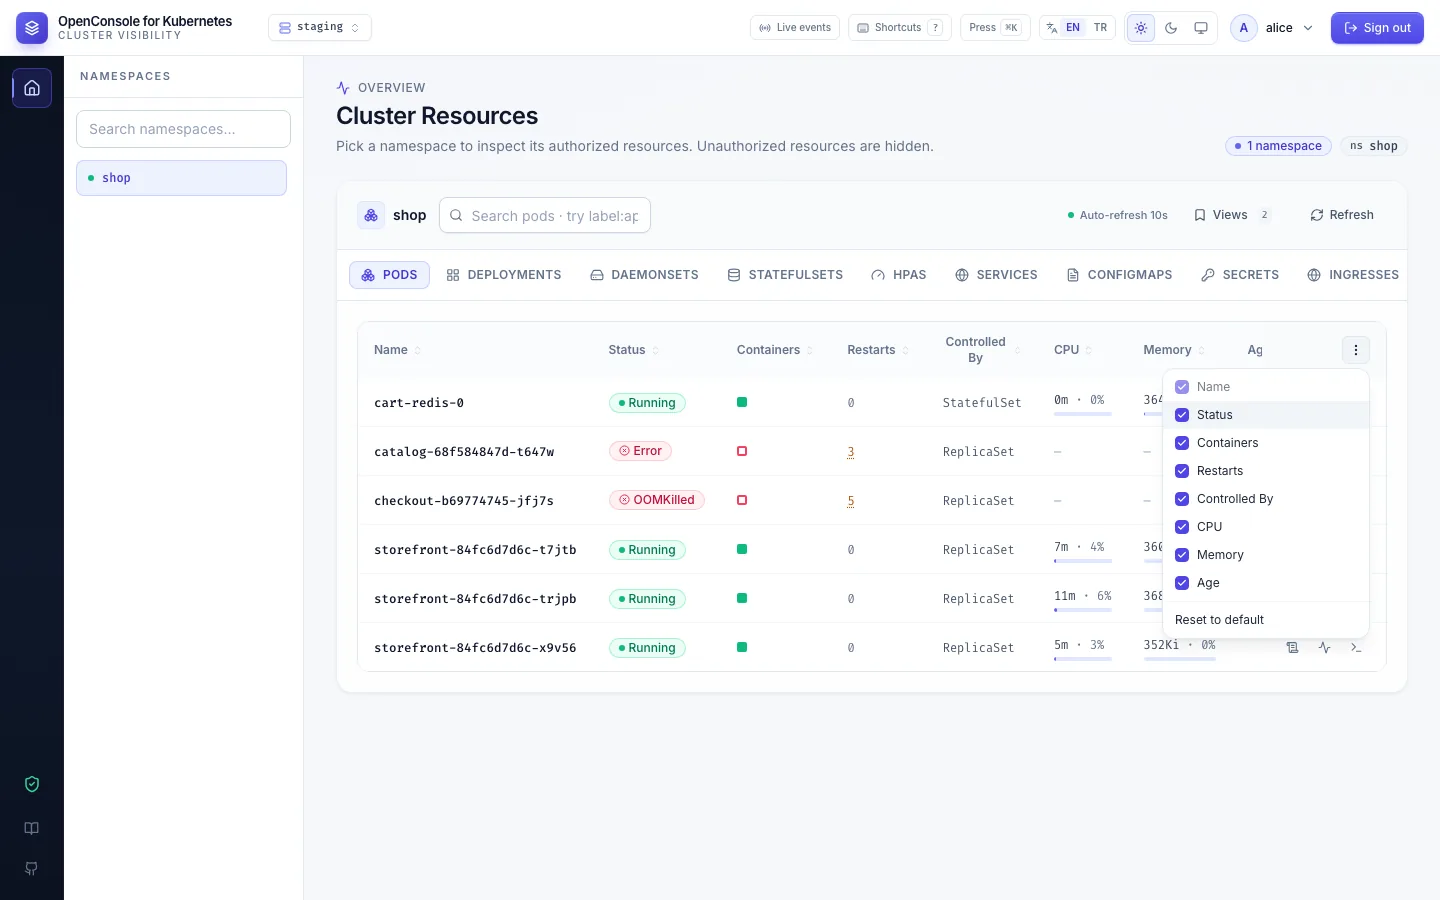
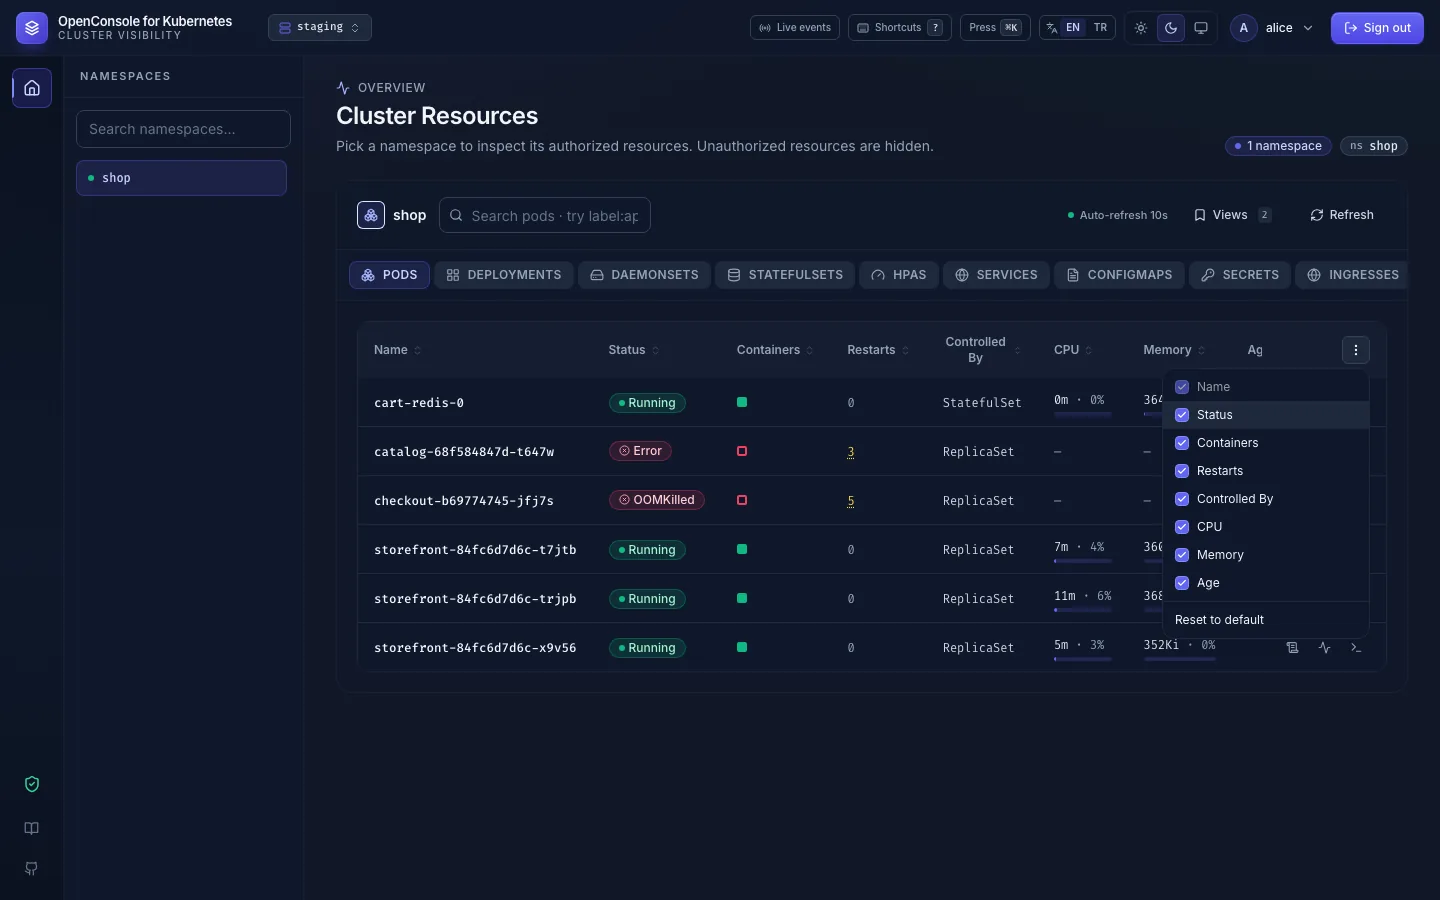
Search and label filters
Press / (or click the search box) and type. Every word you type must match, in any order, ignoring case; part of
a word is enough. A word matches the name or the text of any column, hidden columns included, so the table and
the cards find the same rows:
| Tab | Also matched |
|---|---|
| Pods | status, container names, Controlled By (kind and name) |
| Deployments, StatefulSets, DaemonSets | status, replicas (2/3) |
| Services | type, cluster IP, external IPs, ports (80, 8080/TCP, target port, node port, port name) |
| ConfigMaps, Secrets | key names, secret type |
| Ingresses | hosts and paths |
| CronJobs, Jobs | schedule, status |
| HPAs | target (Deployment/web), min / max |
Ages, restarts, CPU, memory and things that aren't columns (node, pod IP, image) are not searched.
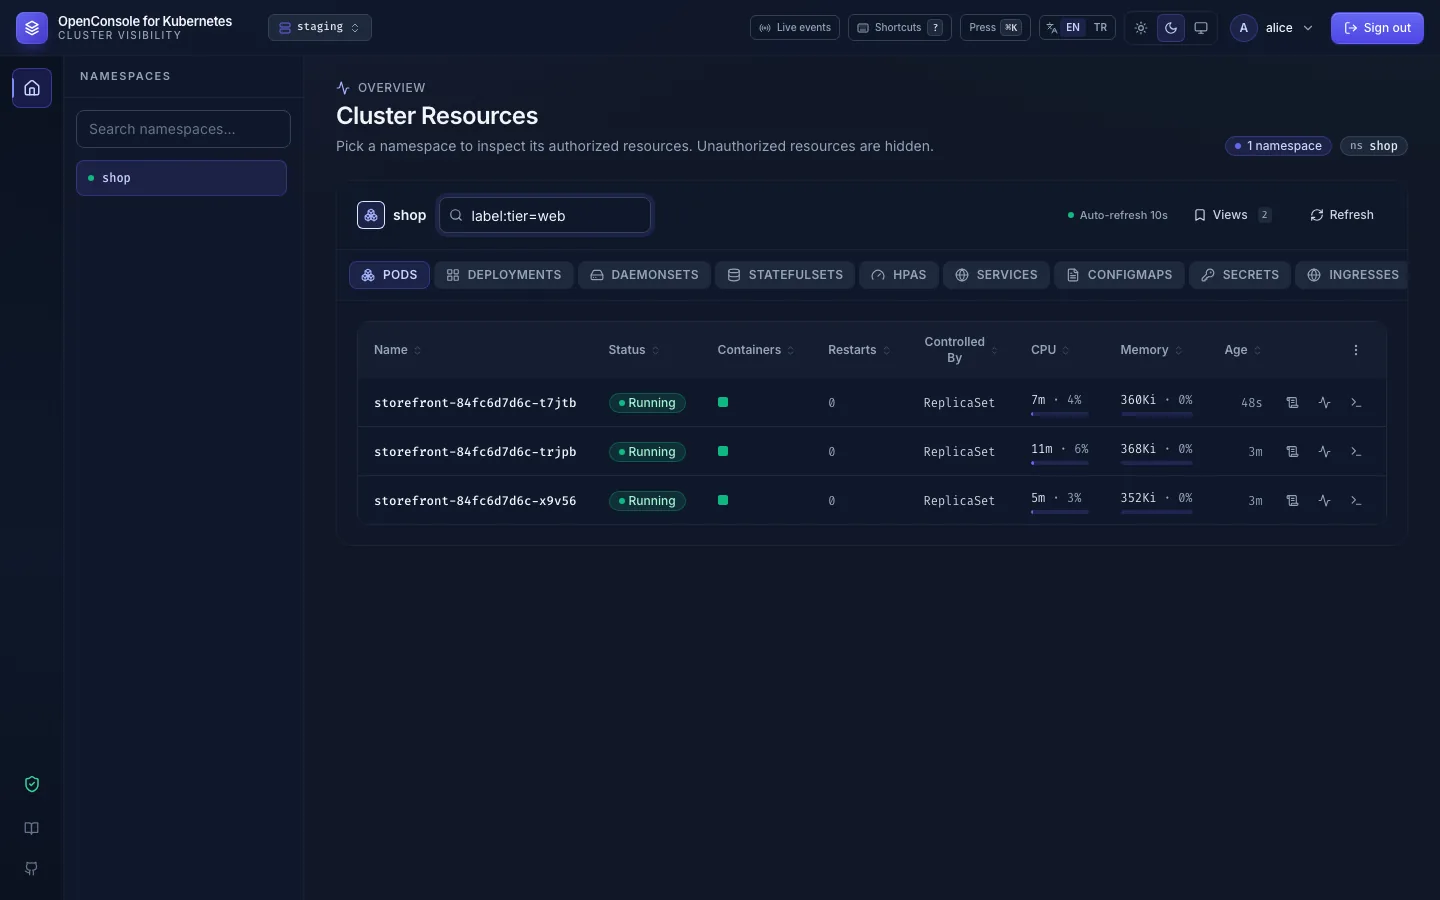
label:key=value keeps the objects with that label value, label:key the ones that have the label at all. Combine
them with words: label:tier=web storefront.
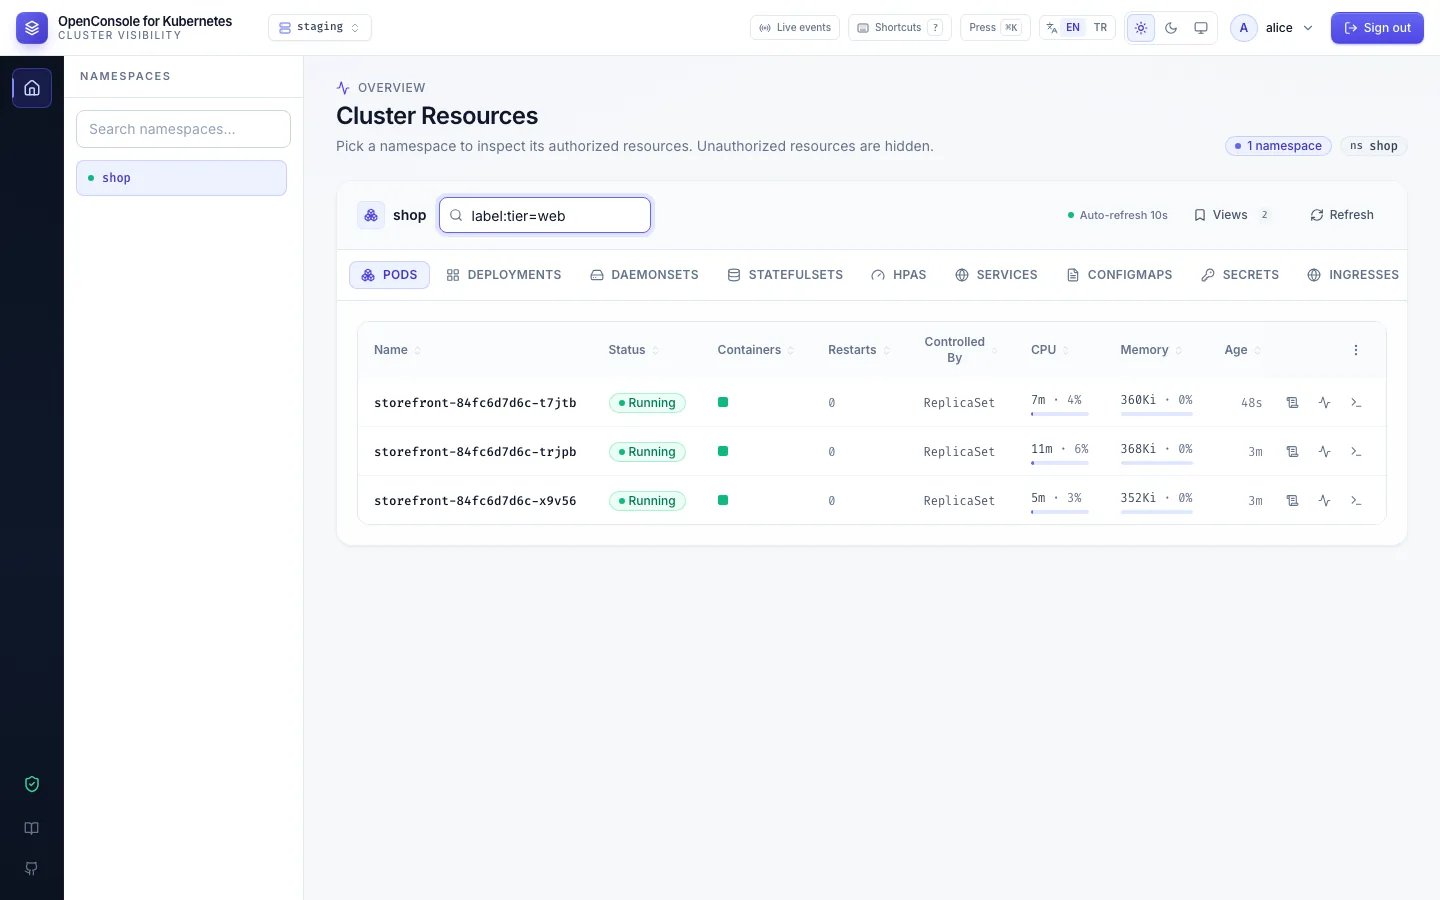
What each pod row offers
- Logs, Events and, if you may, Shell (Logs, Pod shell).
- Click the row, or
Tabto the pod's name and pressEnter, for its details (Detail drawers). The same works for Deployments, StatefulSets and DaemonSets. - The status, restarts and containers columns are explained in Pod health.
- A tab is missing: you don't hold
<kind>:listin this namespace (e.g.deployments:list). - No Shell button: you don't hold
pods:exec, or the admin switched shells off for everyone. - No CPU / memory: the cluster has no metrics-server; ask your admin.
- An empty list that should not be empty: check the search box and the namespace.