Detail drawers
You want to: see everything about one workload without opening five screens.
Click a pod, Deployment, StatefulSet or DaemonSet in the list (or press Enter on a selected row). The drawer opens
on the right; Esc closes it.
Pod
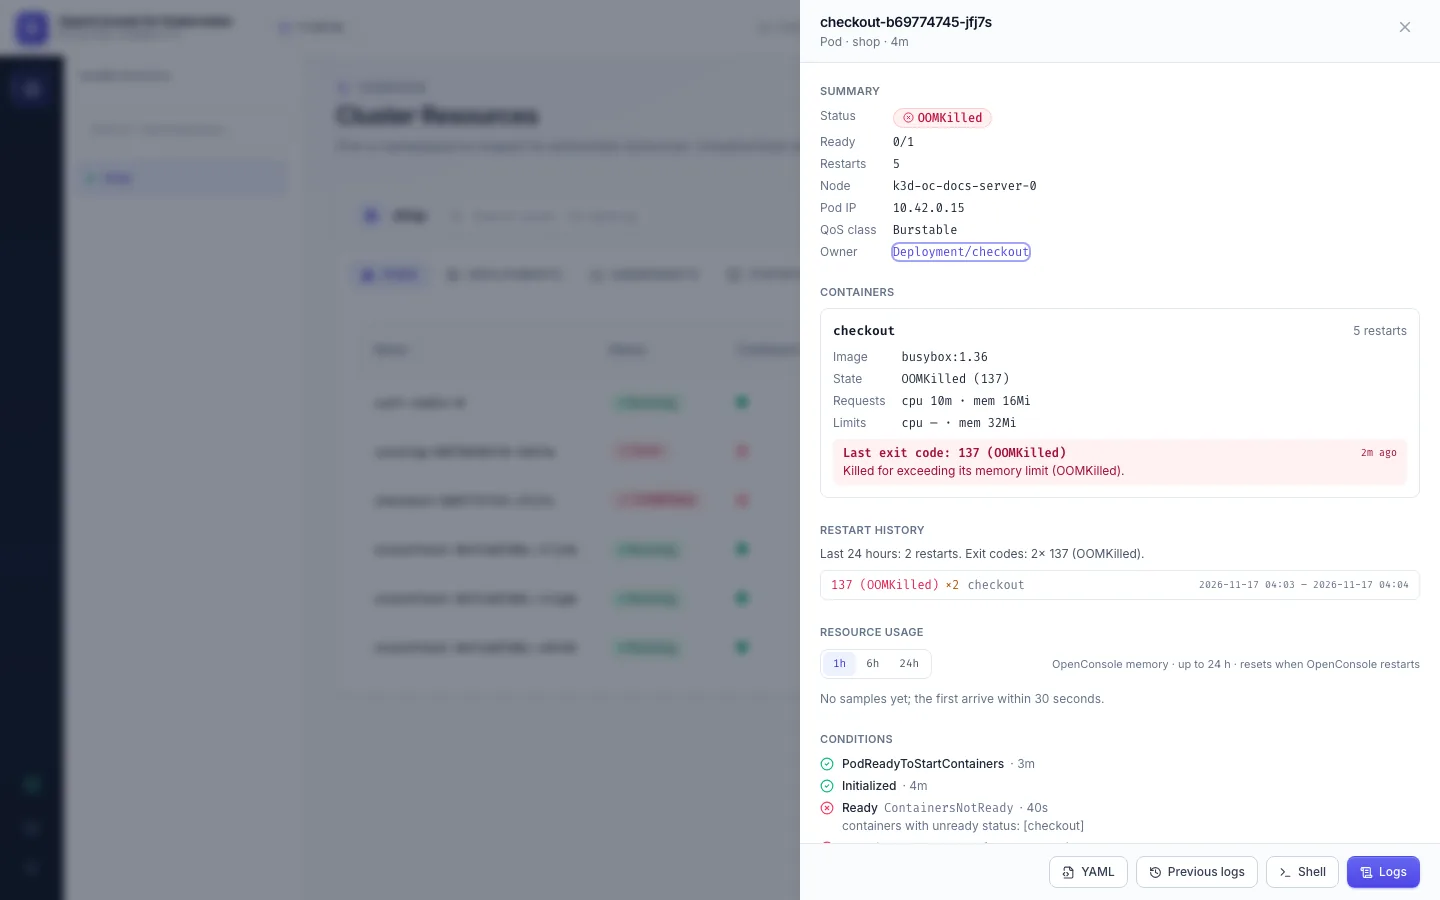
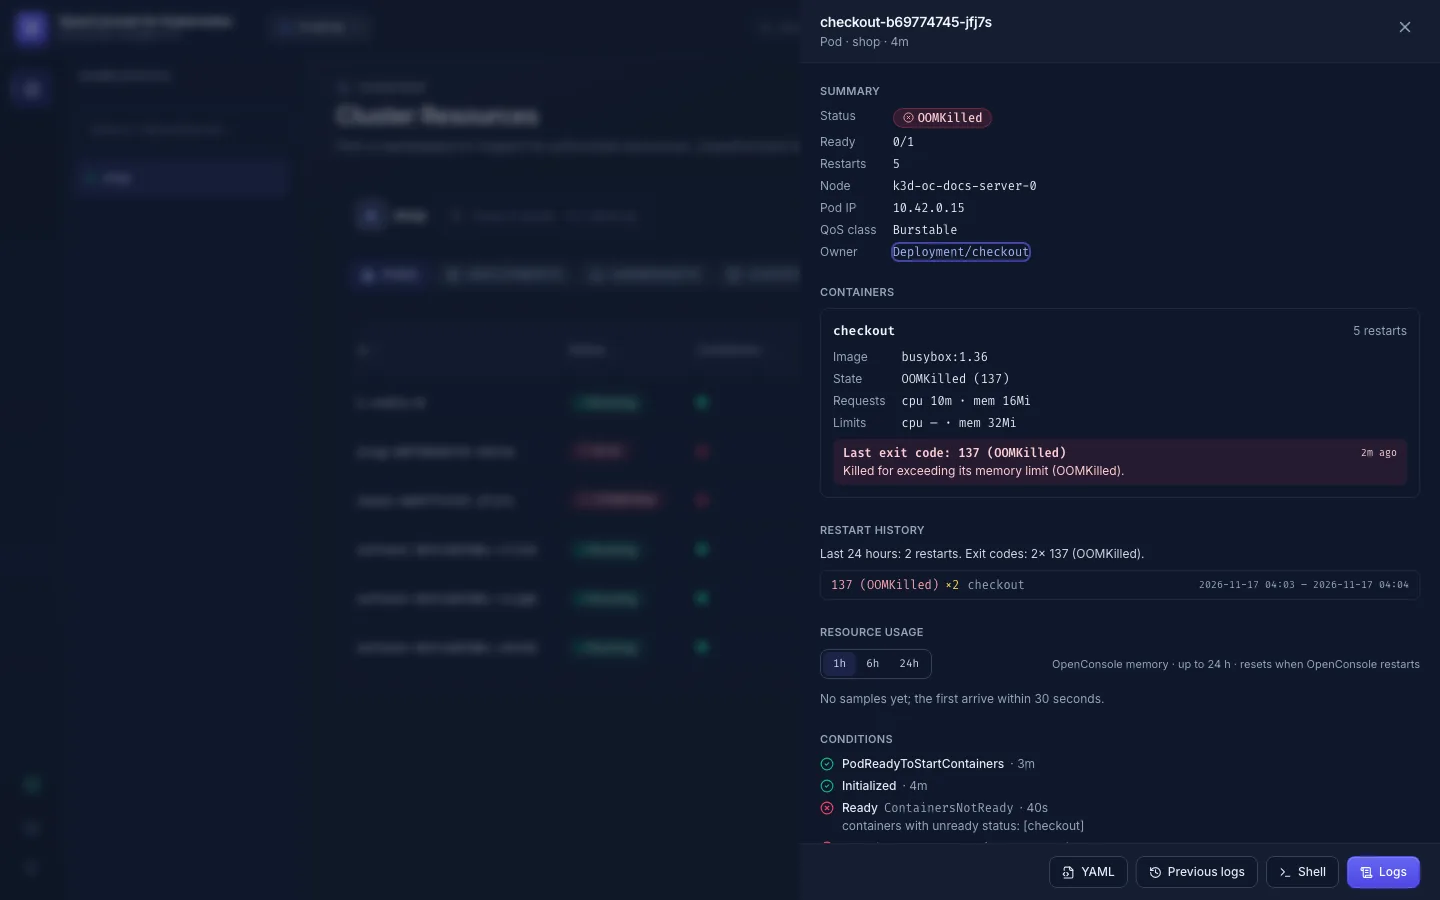
- Summary: status, ready containers, restarts, node, pod IP, QoS class and owner (a link to the workload).
- Containers: image, state, requests and limits, probes, usage, and the last exit code with an explanation.
- Restart history, Resource usage (1 h / 6 h / 24 h, more with Prometheus), Conditions and Events, warnings first.
- Buttons at the bottom, as your permissions allow: YAML, Previous logs, Shell, Logs.
Deployment, StatefulSet, DaemonSet
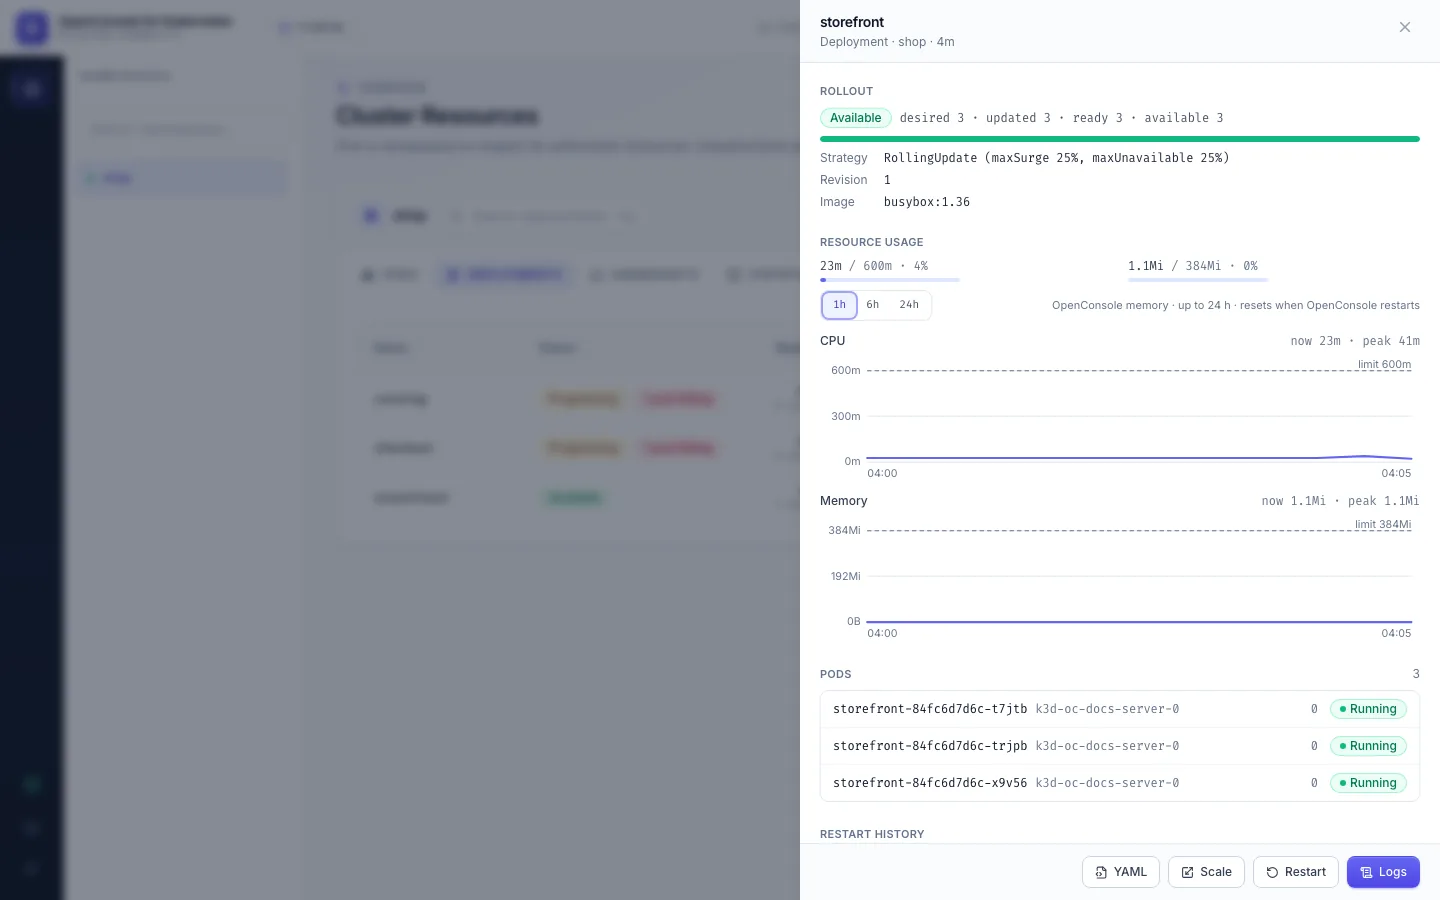
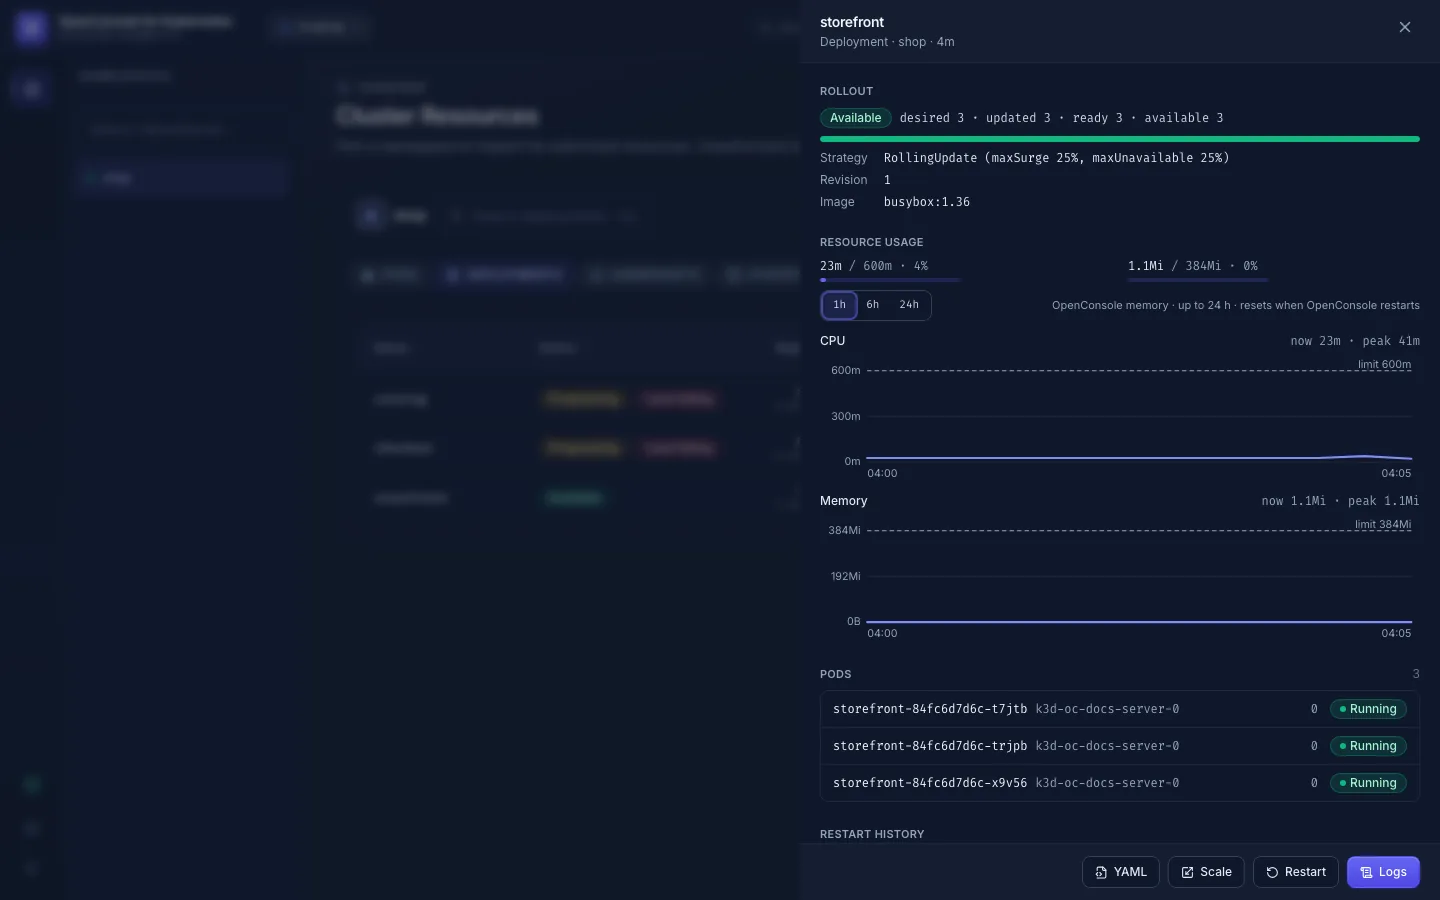
- Rollout: desired, updated, ready and available replicas, strategy, revision and image. It turns red on
ProgressDeadlineExceededand says how many pods are failing. - Resource usage of all its pods together, against their limits.
- Pods: each with node, restarts and status; click one to open it.
- Restart history of its pods, including pods it has already replaced.
- A Deployment also lists its revisions with their image and restart time (read only; there is no rollback).
- Buttons, as your permissions allow: YAML, Scale, Restart, Logs (all pods together).
Events
The Events of both drawers, and the list behind a row's Events button, are the last hour's, warnings first,
and follow the object live: a new event appears as it happens, a repeat updates its count (×5) and time, and
Live next to them says the stream is on (Reconnecting… while it comes back; the list is read again then).
They come from the same stream as Live Events, limited to this object.
Can't see it or can't do it?
- A button is missing: you lack its permission in this namespace:
pods:logs,pods:exec,deployments:restart,deployments:scale/statefulsets:scale,<kind>:editfor YAML changes. - No revisions: the cluster connection can't read ReplicaSets; ask your admin.
- The node is not a link: only admins can open nodes.